Parsing, especially hard parsing, are non-productive operation and can consume significant system resources, leading to library cache contention. ASH can be used to diagnose and analyze excessive parsing through its sampling mechanism. This blog explores how to effectively use ASH to identify parsing issues.
Simulating a Parsing Issue
First, we use the following PL/SQL anonymous block to simulate a parsing issue:
SQL> set timing on
SQL> create table yuan_obj as select * from dba_objects;

Table created.

Elapsed: 00:00:00.746
SQL>
SQL> declare
  2    i number;
  3    sql_text varchar2(256);
  4  begin
  5    for i in 1..100000 loop
  6       sql_text := 'select object_name from yuan_obj where object_id = '||i;
  7       execute immediate sql_text;
  8    end loop;
  9  end;
 10  /

PL/SQL procedure successfully completed.

Elapsed: 00:05:44.904
This scenario is a classic example of inefficient SQL execution due to the lack of bind variables.
Detecting Parsing Issues
The columns in_parse and in_hard_parse in the v$active_session_history and DBA_HIST_ACTIVE_SESS_HISTORY views can be used for detecting parsing issues:
in_parse: This column indicates whether the session is currently performing a parse operation.in_hard_parse: This column indicates whether the session is performing a hard parse.
The following SQL query groups and counts the occurrences of parsing activities in the last 10 minutes:
col in_parse form a10
col in_hard_parse form a10
select in_parse,
       in_hard_parse,
       count(*) as cnt,
       100 * trunc(ratio_to_report(count(*)) over (), 4) as "PERCENT"
  from v$active_session_history
 where sample_time > current_timestamp - interval '10' minute
 group by in_parse, in_hard_parse
 order by count(*) desc;
When running the inefficient PL/SQL block, we get output like this:
IN_PARSE   IN_HARD_PARSE     CNT   PERCENT
Y          Y                 229     91.23
Y          N                  17      6.77
N          N                   5      1.99
This output show that the parsing, especially hard parsing, constitute the majority of database activities, with only 1.99% of the database devoted to actual query execution.
Let’s dig it deeper by analyzing wait events the database are experiencing:
col event form a30
set linesize 200
SELECT
    NVL(event, 'ON CPU') AS event,
    COUNT(*) AS total_wait_time,
    TO_CHAR(100 * TRUNC(RATIO_TO_REPORT(COUNT(*)) OVER (), 6), 'FM990.9999') || '%' AS "%"
FROM
    v$active_session_history
WHERE
    sample_time > SYSDATE - 10 / 60 / 24
GROUP BY
    event
ORDER BY
    total_wait_time DESC;
Output:
EVENT                          TOTAL_WAIT_TIME %
------------------------------ --------------- ----------
ON CPU                                     503 92.1245%
latch: shared pool                          38 6.9597%
library cache: mutex X                       4 0.7326%
latch: row cache objects                     1 0.1831%
This output indicates that parsing is heavily utilizing CPU and spilling over into related Oracle waits.
Identifying Problematic SQL Statements
To identify problematic SQL statements, leverage the force_matching_signature column in v$sqlstats. This column contains a hash value that identifies SQL statements that are textually similar but may have different literals. This hash value is used for cursor sharing based on similar, but not identical SQL statements.
The query below joins v$active_session_history with v$sqlstats to retrieve SQL statements sharing the same force_matching_signature as the most frequently executed SQL statement.
SELECT a.sample_time,
       a.sql_id,
       NVL(a.event, 'CPU') AS event,
       a.in_parse,
       a.in_hard_parse,
       a.force_matching_signature,
       t.exact_matching_signature,
       t.sql_text
FROM v$active_session_history a
LEFT JOIN v$sqlstats t ON a.sql_id = t.sql_id
WHERE t.force_matching_signature = (
    SELECT force_matching_signature
    FROM (
        SELECT s.force_matching_signature, COUNT(*) AS cnt
        FROM v$sqlstats s
        GROUP BY s.force_matching_signature
        ORDER BY COUNT(*) DESC
    )
    WHERE ROWNUM = 1
);
Another way to find out similar SQL statements is to compare edited SQL text:
SELECT a.sample_time,
       a.sql_id,
       NVL(a.event, 'CPU') AS event,
       a.in_parse,
       a.in_hard_parse,
       a.force_matching_signature,
       t.exact_matching_signature,
       t.sql_text
FROM v$active_session_history a
LEFT JOIN v$sqlstats t ON a.sql_id = t.sql_id
WHERE SUBSTR(t.sql_text, 1, 40)= (
    SELECT truncated_sql_text
    FROM (
        SELECT SUBSTR(s.sql_text, 1, 40) AS truncated_sql_text,  COUNT(*) AS cnt
        FROM v$sqlstats s
        GROUP BY SUBSTR(s.sql_text, 1, 40)
        ORDER BY COUNT(*) DESC
    )
    WHERE ROWNUM = 1
);
While both queries serve the same purpose, the query using force_matching_signature is generally more accurate. In this case, the both queries yield the same output as shown below (truncated for brevity):
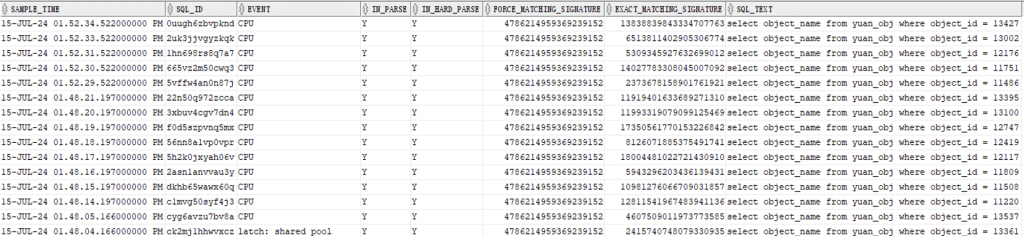
The output shows how textually similar SQL statements (with the same FORCE_MATCHING_SIGNATURE, that is 4786214959369239152) can have different literal values and therefore different EXACT_MATCHING_SIGNATURE and different SQL_ID.
Solutions
After identifying the problematic SQL statements, we should collaborate with application vendor to modify application code. The goal is to replace literals with bind variables wherever possible. This modification allows Oracle to reuse execution plans, thereby reducing the overhead associated with parsing.
The preceding inefficient PL/SQL can be optimized as below:
SQL> alter system flush shared_pool;

System altered.

SQL> set timing on
SQL> DECLARE
  2    i NUMBER;
  3  BEGIN
  4    FOR i IN 1..100000 LOOP
  5      EXECUTE IMMEDIATE 'select object_name from yuan_obj where object_id = :1' USING i;
  6    END LOOP;
  7  END;
  8  /

PL/SQL procedure successfully completed.

Elapsed: 00:00:03.298
The optimized block is significantly faster, reducing execution time from nearly 6 minutes to just over 3 seconds.
After running the optimized block, retrieve the information about the executions of the prior SQL from the v$active_session_history and v$sqlstats views:
SELECT a.sample_time,
       a.sql_id,
       NVL(a.event, 'CPU') AS event,
       a.in_parse,
       a.in_hard_parse,
       a.force_matching_signature,
       t.exact_matching_signature,
       t.sql_text
FROM v$active_session_history a
LEFT JOIN v$sqlstats t ON a.sql_id = t.sql_id
WHERE SUBSTR(t.sql_text, 1, 40)= substr('select object_name from yuan_obj where object_id =',1,40);

The output contains only two entries of the executed SQL. The identical values for SQL_ID, FORCE_MATCHING_SIGNATURE,EXACT_MATCHING_SIGNATURE and SQL_TEXT indicate that the SQL was parsed only once, and its execution plan was reused, this greatly reduce the footprint in the Library Cache.
Another method to alleviate contention of Library Cache is to increase the size of Shared Pool. This adjustment can enhance the likelihood that the frequently executed SQL statements and their execution plan remain cached in the Library Cache, thereby reducing the need for repeated parsing.
In some cases, setting the CURSOR_SHARING parameter to FORCE can help reduce hard parsing by forcing Oracle to replace literals with bind variables internally. However, this should be considered a session-level, temporary solution rather than a instance-level, permanent solution.


Leave a comment