This article explores how CPU starvation manifests in Oracle AWR reports. The discussion is divided into three parts:
- Why Doesn’t % DB Time Add Up to 100%?
- Don’t Be Fooled by CPU Utilization
- ASH to the Rescue
Don’t Be Fooled by CPU Utilization
You might think low CPU utilization means the system isn’t CPU-bound. However, in many cases, CPU utilization can be misleading. Consider the following “Host CPU” section from an AWR report:

Host CPU
| CPUs | Cores | Sockets | Load Average Begin | Load Average End | %User | %System | %WIO | %Idle |
|---|---|---|---|---|---|---|---|---|
| 960 | 120 | 2.92 | 176.11 | 7.0 | 2.1 | 0.8 | 90.9 |
The “%Idle” value of 90.9% suggests the system has ample CPU capacity. This can be verified using the “Operating System Statistics” section:
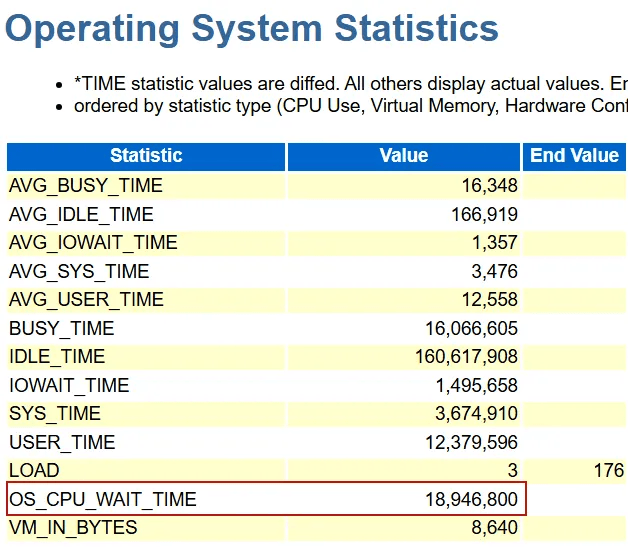
Here, Idle CPU (%) = IDLE_TIME / (BUSY_TIME + IDLE_TIME) × 100, this is 160617908 / (160617908 + 16066605) × 100 =90.91%, this calculation aligns with our earlier query. With “%Idle” being 90.9%. You may easily conclude that this system is not CPU-bound. But in fact, this system is seriously CPU-bound.
The system has 120 physical cores but 960 logical CPUs, likely due to IBM’s Simultaneous Multi-Threading (SMT) technology, which maps one core to eight logical CPUs. Operating systems calculate utilization based on logical CPUs, which understates the load on physical cores. To estimate core utilization: Core Utilization (%)=(100−90.9)×8=9.1×8=72.8%. This indicates a significant load on the physical cores.
The “Load Average End” of 176.11 exceeds the number of cores (120), meaning approximately 1.5 processes are competing for each core when the end snapshot was being created, confirming CPU contention.
The most convincing metric lies in the “OS_CPU_WAIT_TIME”. On traditional Unix systems, the AWR report includes “OS_CPU_WAIT_TIME” in the “Operating System Statistics” section, which measures the time user processes spend in the CPU run queue. In this case, OS_CPU_WAIT_TIME (18,946,800) surpasses BUSY_TIME (16,066,605), indicating that processes spend more time waiting in the CPU run queue than executing on the CPU.
Unfortunately, on Linux and Windows platforms, the “OS_CPU_WAIT_TIME” metric is unavailable. other signs of CPU starvation include:
- Inflated wait time: High-frequency wait events, like “direct path read,” or “db file sequential read”, exhibit significantly increased average wait times due to delays in accessing the CPU.
- Widened Gaps Between Events: The foreground event “log file sync” typically triggers the background event “log file parallel write.” Normally, “log file sync” is slightly longer than “log file parallel write.” In a CPU-bound system, the gap widens because processes struggle to access the CPU for posting or execution.
When the system is CPU-bound, Oracle’s instrumentation is inaccurate. When timing distortions are present, evaluate their significance. If they are not significant, you can interpret the timing metrics with the understanding that they might be less reliable, much like driving a car with a loose steering wheel. However, if the distortions are significant, you should prioritize reducing CPU usage.


Leave a comment