In the “SQL statistics” section of an Oracle AWR report, both SQL and PL/SQL are listed. This results in the double-counting SQL statements executed within PL/SQL blocks. For example, a resource-intensive SQL statement can propel both itself and its parent PL/SQL to the top of the list, making it seem like two distinct performance issues.
To accurately identify the origin of expensive SQL calls, we must map SQL statements to their parent PL/SQL objects. While the AWR report itself doesn’t explicitly capture this child-parent hierarchy, Active Session History (ASH) data records the top-level SQL ID for each sample, enabling us to trace SQL execution back to its originating PL/SQL.
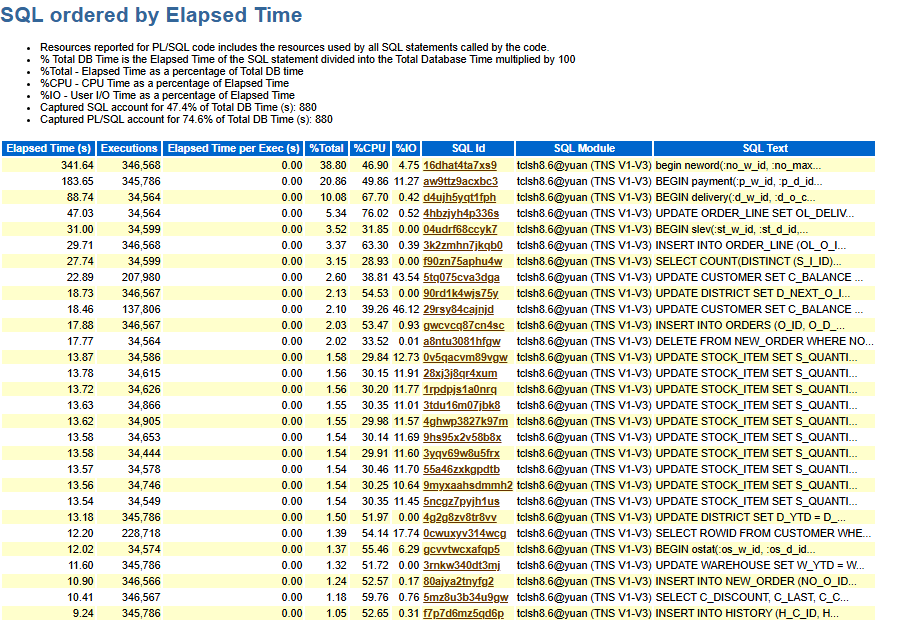
In this AWR report (ending snap id is 5947), the top SQL ID—16dhat4ta7xs9—is apparently a PL/SQL procedure. To analyze its internal activity, we can break down all the SQL executed within it using the query below:
DEFINE top_level_sql_id = '16dhat4ta7xs9';
DEFINE snap_id = 5947;

SELECT
    sql_id,
    sql_opname,
    COUNT(*)
FROM
    dba_hist_active_sess_history
WHERE
    top_level_sql_id = '&top_level_sql_id'
    AND snap_id = &snap_id
GROUP BY
    sql_id,
    sql_opname
ORDER BY
    COUNT(*) DESC;
The output:
         SQL_ID        SQL_OPNAME    COUNT(*)
________________ _________________ ___________
16dhat4ta7xs9    PL/SQL EXECUTE              9
3yqv69w8u5frx    UPDATE                      3
1rpdpjs1a0nrq    UPDATE                      3
9hs95x2v58b8x    UPDATE                      2
55a46zxkgpdtb    UPDATE                      2
28xj3j8qr4xum    UPDATE                      2
9myxaahsdmmh2    UPDATE                      2
90rd1k4wjs75y    UPDATE                      2
                                             1
5mz8u3b34u9gw    SELECT                      1
80ajya2tnyfg2    INSERT                      1
gwcvcq87cn4sc    INSERT                      1
5ncgz7pyjh1us    UPDATE                      1
3k2zmhn7jkqb0    INSERT                      1

14 rows selected.
This analysis reveals that the PL/SQL procedure (16dhat4ta7xs9) executed 12 distinct SQL statements. Many of these also appear individually in the AWR report’s “SQL Statistics” section, confirming their their resource intensity. The row with a null SQL_ID likely corresponds to a COMMIT operation.
The PL/SQL procedure itself accounts for 9 out of 31 samples, showing that its own internal logic—not just the SQL it executes—is a major contributor to runtime. This challenges the common assumption that tuning PL/SQL is merely a matter of tuning embedded SQL.
The SQL ID “d4ujh5yqt1fph” ranks third on the list and is also a PL/SQL. Its breakdown using the same method:
          SQL_ID        SQL_OPNAME    COUNT(*)
________________ _________________ ___________
4hbzjyh4p336s    UPDATE                      5
a8ntu3081hfgw    DELETE                      2
d4ujh5yqt1fph    PL/SQL EXECUTE              1
arykx3hpq9xsa    UPDATE                      1
Here, the UPDATE statement 4hbzjyh4p336s accounts for 5 of the 9 total samples and ranks fourth in the AWR report’s SQL list. Optimizing this statement could significantly improve the performance of the parent PL/SQL procedure.


Leave a comment