I was given an Oracle AWR report where the client complained about intolerably slow performance.
Top 10 Foreground Events by Total Wait Time
| Event | Waits | Total Wait Time (sec) | Wait Avg(ms) | % DB time | Wait Class |
|---|---|---|---|---|---|
| gc buffer busy release | 776,713 | 267.3K | 344 | 31.9 | Cluster |
| enq: TX – index contention | 307,233 | 261.5K | 851 | 31.2 | Concurrency |
| log file sync | 476,290 | 188.5K | 396 | 22.5 | Commit |
| gc buffer busy acquire | 426,428 | 116K | 272 | 13.9 | Cluster |
| buffer busy waits | 463,657 | 11.8K | 25 | 1.4 | Concurrency |
| db file sequential read | 122,637 | 10.1K | 83 | 1.2 | User I/O |
| db file scattered read | 60,974 | 8048.4 | 132 | 1.0 | User I/O |
| reliable message | 1,045,527 | 4079.7 | 4 | .5 | Other |
| gc current block busy | 13,606 | 3866.1 | 284 | .5 | Cluster |
| DB CPU | 3593.6 | .4 |
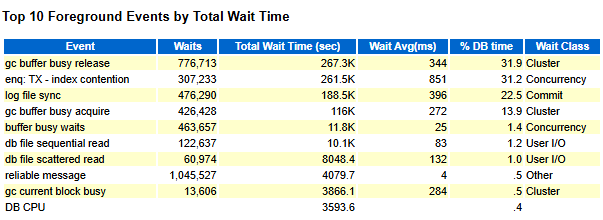
At first glance, I notice that the typical block transfer events (e.g. gc current/cr block 2-way/3-way) are absent. Instead, the dominant waits are contention-oriented:
gc buffer busy releasegc buffer busy acquiregc current block busygc cr block busy
This pattern indicates that blocks were not being transferred smoothly across RAC nodes.
The problem is not the volume of block transfers, but the delays during the block shipping process.
To pinpoint which phase of the block transfer was problematic, I examined the“RAC Statistics” section in the AWR report. The data revealed the following metrics:
Global Cache and Enqueue Services – Workload Characteristics
| Avg global enqueue get time (ms): | 50.2 |
| Avg global cache cr block receive time (ms): | 3.8 |
| Avg global cache current block receive time (ms): | 13.1 |
| Avg global cache cr block build time (ms): | 0.0 |
| Avg global cache cr block send time (ms): | 0.0 |
| Global cache log flushes for cr blocks served %: | 9.5 |
| Avg global cache cr block flush time (ms): | 266.7 |
| Avg global cache current block pin time (ms): | 3.0 |
| Avg global cache current block send time (ms): | 0.0 |
| Global cache log flushes for current blocks served %: | 16.4 |
| Avg global cache current block flush time (ms): | 398.1 |

The “Global Cache and Enqueue Services – Workload Characteristics” section confirms transfer inefficiencies. Both CR (consistent read) and current block receive times are elevated, exceeding healthy thresholds (of less than 1 millisecond.
In RAC, blocks are transferred between nodes through cache fusion, which involves three phases on the serving node: build/pin, flush, and send. In this case, the build/pin and send times are negligible (0 ms), but the flush times are extremely high—266.7 ms for consistent read (CR) blocks and 398.1 ms for current blocks.
The Top Event “log file sync” shows an average wait of 396 ms per commit, which is abnormally high and further confirms severe redo I/O latency.
Further investigation with the Storage and System Administrators revealed that the disk group holding redo logs was malfunctioning, causing excessive write latency.


Leave a comment