Before analyzing the SQL lists in the “SQL Statistics” section, it’s important to understand how representative the captured SQL statements are of the overall workload.
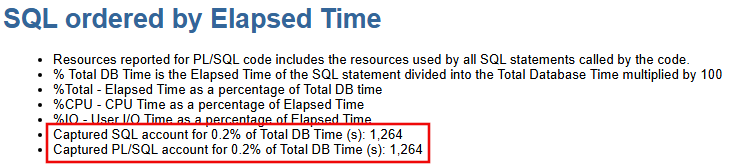
In this top SQL list, it states:
- Captured SQL accounts for 0.2% of total DB Time
- Captured PL/SQL accounts for 0.2% of total DB Time
When the captured portion is this small, analyzing the list is almost meaningless.
However, judging the representiveness of “SQL ordered by Elapsed Time” list can be tricky. The percentage shown reflect the proportion of captured SQL time relative to total DB Time, rather than the total SQL execution elapsed time. In this example, Oracle states that captured SQL accounts for 59.2% of total DB Time. At first glance, this seems to suggest that 40.8% of SQL execution time is unaccounted for.

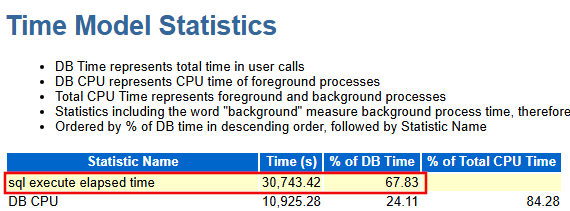
But DB Time is not the same as SQL execution elapsed time. If we look at the Time Model Statistics section in the AWR report, we see that “sql execute elapsed time” is only 67.83% of DB Time. This means the maximum possible captured percentage is 67.83% of total DB Time—not 100%. Recalculating, 59.2 ÷ 67.83 ≈ 87%. In other words, the captured SQL actually represents about 87% of the total SQL execution elapsed time, it’s a highly representative sample. On the other hand, since captured PL/SQL execution accounts for 67.5% of total DB Time, we can infer that nearly all SQL were executed within PL/SQL procedures, and that all major PL/SQL procedures were successfully captured.
The higher the percentage of captured SQL, the more reliable the list is for workload analysis. Conversely, a low percentage suggests the list is less representative. For “SQL ordered by Elapsed Time,” you should always translate Oracle’s DB Time–based percentage into SQL execution elapsed time percentage to see the true representativeness.
Another important detail is that Oracle does not treat COMMIT and ROLLBACK as regular SQL statements. If they were included, COMMIT would frequently, if not always, appear at the top of the list—as is often the case in MySQL.
Oracle only captures SQL statements present in the shared pool (which you can check in views such as V$SQL) at the time an AWR snapshot is being taken. If the captured percentage is low, there are two common reasons:
- Snapshot interval is too long. SQL statements may age out of the shared pool before the snapshot is taken. In this case, shorten the interval between snapshots to improve coverage.
- Heterogeneous SQLs flood the shared pool. The number of similar but distinct SQL statements can be greatly reduced by replacing literals with bind variables. When applications dynamically generate SQL by concatenating strings, they often overwhelm the shared pool, causing many SQLs to age out prematurely before a snapshot is being taken. In such cases, check the “Top SQL using literals” section in the ASH report to identify SQLs that fail to use bind variables.


Leave a comment