One of my clients from a hospital recently complained about slow performance in their Oracle database and sent me the AWR report for analysis. In this post, I’ll walk through my investigation and troubleshooting process.
Load profile — busy but normal
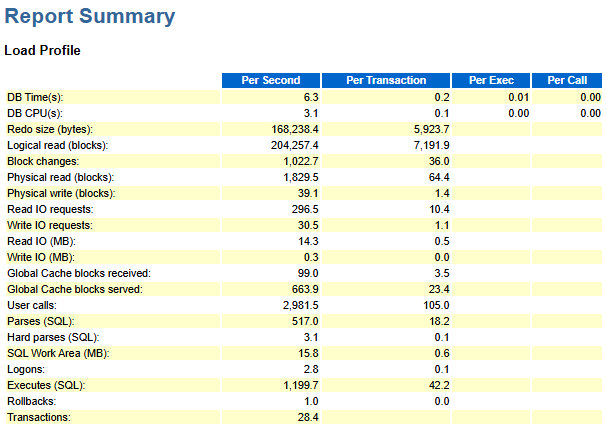
The Load Profile section shows a fairly busy OLTP-style workload, but nothing unusual or alarming so far.
Top wait events — the symptom appears

The Top Events section usually reveals where the pain lies, and this time is no exception.
The second-largest wait event, “log file sync”, shows an intolerably high 78 milliseconds per wait.
Meanwhile, the average wait times for “db file scattered read” and “db file sequential read” are almost zero, indicating excellent storage performance.
So it’s clear this is not a storage problem unless the redo log files and datafiles reside on different disks.
Background waits — the real culprit
I then checked “log file parallel write” in the background wait events, which measures the actual time it takes to write redo data to disk.

An average wait of one millisecond confirms the redo log storage is fast, consistent with other I/O indicators.
However, the top background waits reveal the real problem:
- LNS wait on SENDREQ represents the total time the Log Network Server (LNS) spends waiting for redo to be acknowledged by the standby.
- LGWR-LNS wait on channel means the LGWR (Log Writer) process is waiting for the LNS to finish its work.
These two waits indicate a redo transport bottleneck. The primary database is waiting for the standby to acknowledge redo writes.
Parameter check — data safety over performance
Scrolling down to the init.ora parameters section, I found this line:
| log_archive_dest_2 | SERVICE=datgorcl LGWR SYNC AFFIRM valid_for=(online_logfiles, primary_role) db_unique_name=datgorcl |
(Names have been modified to protect the client’s privacy.)
Breaking it down:
- SYNC: The primary waits for the standby to acknowledge redo before committing.
- AFFIRM: The standby must physically write the redo to disk before confirming.
These settings ensure maximum data protection (no data loss) but at a high cost.
Every commit now waits for both network latency and disk I/O on the standby, leading to slow “log file sync” waits.
RAC statistics — chain reaction
As there are significant GC-related waits among the top events, I then moved on to check the “RAC Statistics” section.

The RAC statistics show poor flush times for both CR and current blocks, a direct result of slow log synchronization.
This, in turn, triggers GC-related waits that appear in the top events section — a classic domino effect.
Root cause — slow standby on virtual machine
After further discussion, I learned that this was a LIS (Laboratory Information System) database.
To ensure data safety, they had configured a standby database on a virtual machine. Unfortunately, the standby’s poor performance dragged down the primary.
Solution — trade safety for performance
My recommendation was to change the parameter log_archive_dest_2:
- SYNC to ASYNC
- AFFIRM to NOAFFIRM
This keeps redo transport in place but avoids forcing every commit to wait for network round-trips.
However, the client decided to go a step further and dropped the standby entirely.
The result: performance was fully restored.


Leave a comment