In Oracle environments, CPU-noisy neighbors are non-Oracle processes that consume significant CPU resources and reduce the CPU available to the database.
CPU-noisy neighbors can be detect by comparing total OS CPU usage with Oracle CPU usage. If the gap between is huge, it strongly suggests the presence of a CPU-noisy neighbors.
Oracle CPU usage can be obtained from DBA_HIST_SYS_TIME_MODEL view. Although DBAs may not have direct access to the operating system, overall OS CPU usage statistics can still be retrieved from the DBA_HIST_OSSTAT view.
The following query performs a a normalized comparison:
- It calculates Oracle CPU usage by summing up
DB CPUandbackground cpu timefromDBA_HIST_SYS_TIME_MODEL. Since these values are stored in microseconds, they are converted to seconds. - It retrieves
USER_TIMEfromDBA_HIST_OSSTAT. Since this value is stored in centiseconds, it is converted to seconds. - It joins the two datasets on the
SNAP_IDto produce a snapshot-by-snapshot timeline of CPU consumption.
SELECT s.snap_id, ROUND(s.oracle_cpu_s, 2) AS oracle_cpu_s, ROUND(o.os_busy_s, 2) AS os_busy_s, ROUND(o.os_busy_s - s.oracle_cpu_s, 2) AS gap_s, CASE WHEN o.os_busy_s > 0 THEN ROUND(((o.os_busy_s - s.oracle_cpu_s) / o.os_busy_s) * 100, 2) ELSE 0 END AS gap_percentageFROM ( SELECT snap_id, instance_number, SUM(value)/1000000 AS oracle_cpu_s FROM dba_hist_sys_time_model WHERE dbid = 2788912098 AND instance_number = 1 AND stat_name IN ('background cpu time', 'DB CPU') GROUP BY snap_id, instance_number) sJOIN ( SELECT snap_id, value/100 AS os_busy_s FROM dba_hist_osstat WHERE dbid = 2788912098 AND instance_number = 1 AND stat_name = 'USER_TIME') o ON s.snap_id = o.snap_id ORDER BY s.snap_id DESC;
Sample output
   SNAP_ID    ORACLE_CPU_S      OS_BUSY_S         GAP_S    GAP_PERCENTAGE
__________ _______________ ______________ _____________ _________________
     50712      32621339.3    34187616.44    1566277.14              4.58
     50711     32532231.27    34095900.64    1563669.37              4.59
     50710     32445891.45    34007503.81    1561612.36              4.59
     50709     32363355.96    33923034.77    1559678.81               4.6
     50708     32272098.13    33831304.03     1559205.9              4.61
     50707     32193791.69    33752681.38    1558889.69              4.62
     50706     32113523.84    33671579.82    1558055.98              4.63
     50705     32030178.21    33586187.58    1556009.37              4.63
     50704     31945794.11    33498506.01     1552711.9              4.64
     50703        31868399    33415318.24    1546919.24              4.63
     50702     31791799.18    33331371.79    1539572.61              4.62
     50701     31715811.34    33246717.94     1530906.6               4.6
     50700     31643091.58    33171270.36    1528178.78              4.61
     50699     31562560.85    33087934.53    1525373.68              4.61
     50698     31473624.69    32996272.74    1522648.05              4.61
     50697     31387476.77    32908156.72    1520679.95              4.62
     50696     31321143.24    32841454.29    1520311.05              4.63
     50695     31218078.07    32737641.08    1519563.01              4.64
     50694      31116317.4    32635014.36    1518696.96              4.65
     50693     31013961.42    32531830.81    1517869.39              4.67
     50692        30911032    32428080.54    1517048.54              4.68
     50691     30807090.49    32323580.95    1516490.46              4.69
     50690     30711283.37    32227000.08    1515716.71               4.7
     50689     30605402.79    32119906.38    1514503.59              4.72
     ...
The output reveals that the gap remains steady at approximately 4.6% across snapshot. A low and steady gap suggests absence of CPU-noisy neighbors.
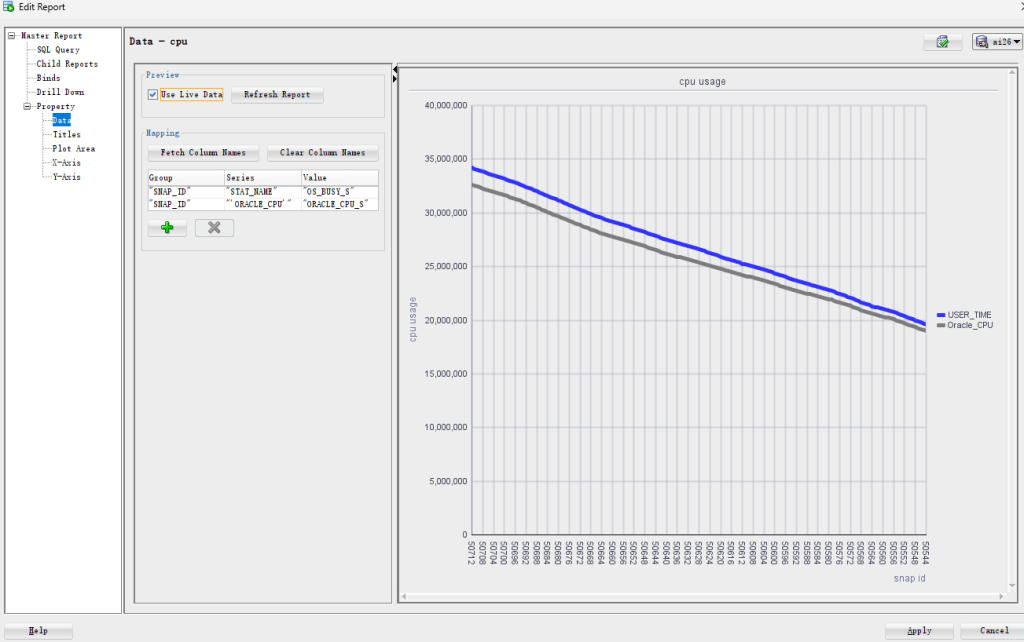
For better readability, we can create a graphical report in SQL Developer by defining a user-defined report using the following query:
SELECT s.snap_id, o.stat_name, 'Oracle_CPU', ROUND(s.oracle_cpu_s, 2) AS oracle_cpu_s, ROUND(o.os_busy_s, 2) AS os_busy_s, ROUND(o.os_busy_s - s.oracle_cpu_s, 2) AS gap_s, CASE WHEN o.os_busy_s > 0 THEN ROUND(((o.os_busy_s - s.oracle_cpu_s) / o.os_busy_s) * 100, 2) ELSE 0 END AS gap_percentageFROM ( SELECT snap_id, instance_number, SUM(value)/1000000 AS oracle_cpu_s FROM dba_hist_sys_time_model WHERE dbid = 2788912098 AND instance_number = 1 AND stat_name IN ('background cpu time', 'DB CPU') GROUP BY snap_id, instance_number) sJOIN ( SELECT snap_id, stat_name, value/100 AS os_busy_s FROM dba_hist_osstat WHERE dbid = 2788912098 AND instance_number = 1 AND stat_name = 'USER_TIME') o ON s.snap_id = o.snap_id ORDER BY s.snap_id DESC;
Set the report stype as ‘Chart’ and chart type as ‘Line’.
From the chart, we can clearly see that the gap between USER_TIME and Oracle_CPU remains stable. As overall CPU usage decreases, the absolute gap also decreases in proportionally.
What makes this method particularly valuable is that it relies solely on AWR data, which is especially useful in environments where OS-level access is restricted.


Leave a comment