The Central Processing Unit (CPU) is the brain of a computer, and for IT professionals, assessing CPU stress is foundational knowledge. However, this task may not be as simple as you think. This is a 4-part article series aim to guide you in evaluating CPU stress.
Part 1: Single-Core CPU Utilization: Demystifies why processes have to wait even when CPU utilization appears low.
Part 2: Multi-Core CPU Utilization: Explores how multiple cores within a CPU complicate the assessment of CPU utilization.
Part 3: CPU Run Queue Size: A more accurate metric for evaluating CPU stress
Part 4: CPU Load: A numerical measure of CPU stress, it differs slightly between Linux and Unix.
CPU Load: A Key Metric Beyond Utilization
Besides CPU utilization, another key metric for assessing stress on CPU is CPU load, a lingo used in operating system. Unlike CPU utilization, which reflects the percentage of time the CPU is busy, CPU load quantifies the number of runnable processes (which will be elaborated later in this article) at a given moment. For example, a CPU load of 1 doesn’t imply 100% CPU utilization; it indicates that one process is runnable. On modern servers with multiple CPUs—such as a quad-core processor—this might simplistically suggest 25% CPU utilization (1 out of 4 cores), though this is an oversimplification since load and utilization aren’t directly equivalent.
A related and frequently used term is load average, which represents the average CPU load over specific time intervals, typically 1, 5, and 15 minutes. I will use these two terms interchangablely in this article.
Several tools can report CPU load, including top, w, sar and uptime. Here’s an example from the uptime command:
oracle@Yuan ~$ uptime
 17:13:56 up 33 days,  2:04,  4 users,  load average: 4.32, 2.72, 1.16
In this output, the values 4.32, 2.72 and1.16 represents the average number of runnable processes over the last 1, 5, and 15 minutes, respectively. This decreasing trend (4.32 to 1.16) suggests that the demand on the system has been diminishing over time.
It worth note that CPU load reporting differs slightly between Linux and traditional Unix systems. To fully understand the naunces, we should first understand process states, the following is an excerpt from manual of ps command:
PROCESS STATE CODES
Here are the different values that the s, stat and state output specifiers (header “STAT” or “S”) will display to describe the state of a process:
D uninterruptible sleep (usually IO)
R running or runnable (on run queue)
S interruptible sleep (waiting for an event to complete)
T stopped by job control signal
t stopped by debugger during the tracing
W paging (not valid since the 2.6.xx kernel)
X dead (should never be seen)
Z defunct (“zombie”) process, terminated but not reaped by its parent
On Linux, the load average counts processes in ‘D’ or ‘R’ states. Here, process is interchangeable with thread and task.
- R (Runnable): A process that is either actively executing on the CPU or waiting in the run queue for the CPU to become available. It’s ready to run but not necessarily running.
- D (Uninterruptible Sleep): A process that cannot be interrupted, typically because it’s waiting for I/O operations (e.g., disk or network I/O) to complete.
The diagram below illustrates what the CPU load consists:
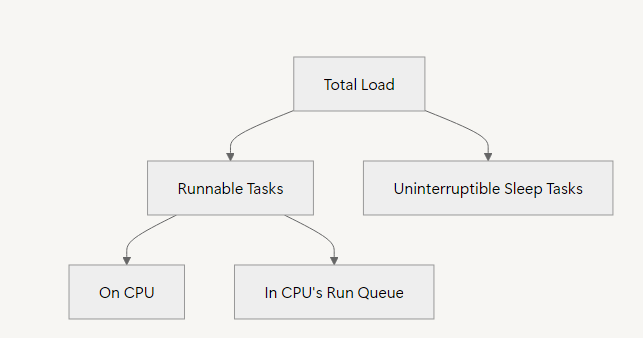
On Linux, the load average includes processes in both R and D states, capturing both CPU demand and I/O-related pressure. This provides a more holistic view of system demand, as uninterruptible sleep tasks still consume resources (e.g., waiting for disk I/O can bottleneck performance).
In contrast, traditional Unix systems typically count only R processes—those actively running or in the run queue—excluding D tasks. As a result, Unix load averages reflect only CPU-specific demand, not broader system stress.
This distinction explains why a Linux system under heavy I/O load might report a higher load average than a Unix system in the same scenario, even if CPU utilization remains similar.
To clarify terminology used earlier in this article: when I referred to “runnable processes,” I meant processes in R and D states on Linux, aligning with its load average definition. On Unix, “runnable” refers solely to R processes.


Leave a reply to How to Assess CPU Stress (Part 2/4): Multi-Core CPU Utilization – Yuan Yao, An Oracle ACE's Blog Cancel reply