This article explores how CPU starvation manifests in Oracle AWR reports. The discussion is divided into three parts:
- Why Doesn’t % DB Time Add Up to 100%?
- Don’t Be Fooled by CPU Utilization
- ASH to the Rescue
Why Doesn’t % DB Time Add Up to 100%?
In Oracle, DB Time is composed of two components: time spent using the CPU (DB CPU) and time spent not using the CPU (non-idle wait time). In an ideal scenario, the following relationship should hold true:
DB Time = DB CPU + Non-idle wait time
Therefore, in the AWR report’s “Top 10 Foreground Events by Total Wait Time“ section, you might expect the sum of “% DB time” column to approximate 100%. However, this is not always the case.
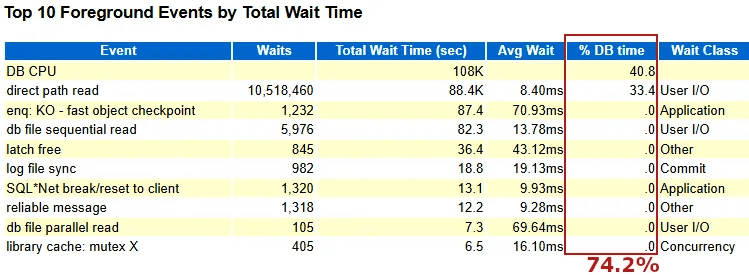
In this example, the sum of “% DB time” is only 74.2%—far short of 100%. Why does this discrepancy occur?
Oracle instruments three time-based metrics:
- DB Time: For each session, Oracle starts a timer at the entry of a database call and stops it at the exit. The difference is recorded as the DB Time for that call. The system-wide DB Time is the sum of DB Time across all sessions.
- Wait Time: When a wait event (e.g., I/O wait or lock contentiont) occurs (e.g., I/O wait), Oracle starts a timer; when the wait ends, the timer stops. The difference is recorded as the wait time. This applies to both idle and non-idle wait events.
- DB CPU: Unlike DB Time and Wait Time, Oracle does not instrument DB CPU itself. Instead, it collects CPU usage data from the operating system, which reports only the actual time a process executes on the CPU.
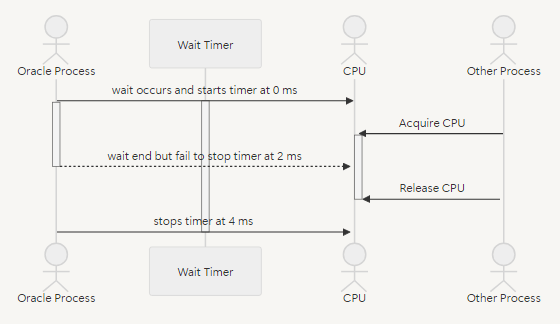
The following diagram demonstrates how Oracle records a 2-millisecond wait.

When a wait event ends, the Oracle foreground process requires a few CPU instructions to stop the timer. In a CPU-bound system, the process may not immediately access the CPU due to competition, causing it to wait in the CPU run queue. This additional delay is included in the recorded wait time, inflating it beyond the actual wait duration. For example, a 2-millisecond wait may be recorded as 4 milliseconds due to CPU starvation, as shown below:
In the provided AWR report, average time for the “direct path read” event increases from normally less than 1ms to 8.4 ms due to this inflation.
However, inflated wait times don’t cause the discrepancy in % DB Time because both wait time and DB Time inflate together. The real culprit lies in DB CPU measurement.
Oracle’s DB Time includes all time from the start to the end of a database call, even if the process is preempted by the operating system’s CPU scheduler (via involuntary context switches) and waits in the run queue. However, the operating system reports DB CPU as only the time the process actually executes on the CPU, excluding run queue wait time.
This mismatch means that time spent in the CPU run queue is included in DB Time but not in DB CPU nor non-idle wait time. In the example, the 74.2% sum of % DB Time suggests that approximately 25.8% of DB Time is spent waiting in the CPU run queue due to CPU starvation.
Please note that timing discrepancies can also occur on healthy systems due to:
- Overlapping measurement: Some wait events consume minimal CPU (e.g., for wakeups or checks), and these CPU instructions are counted as both wait time (by Oracle) and DB CPU (by the OS), leading to slight overlaps.
- Uninstrumented waits events: Rare events within Oracle calls may not be categorized as wait time or DB CPU, causing minor gaps in DB Time accounting.


Leave a reply to Unmasking CPU Starvation in Oracle (Part 2/3): Don’t Be Fooled by CPU Utilization – Yuan Yao, An Oracle ACE's Blog Cancel reply