I am delighted to share that my new Oracle book, Oracle Database Performance Tuning with AWR, ASH and ADDM, will be published by Apress.
For readers interested in the book, I will share a series of previews here. This second post covers the section “Table of Contents“
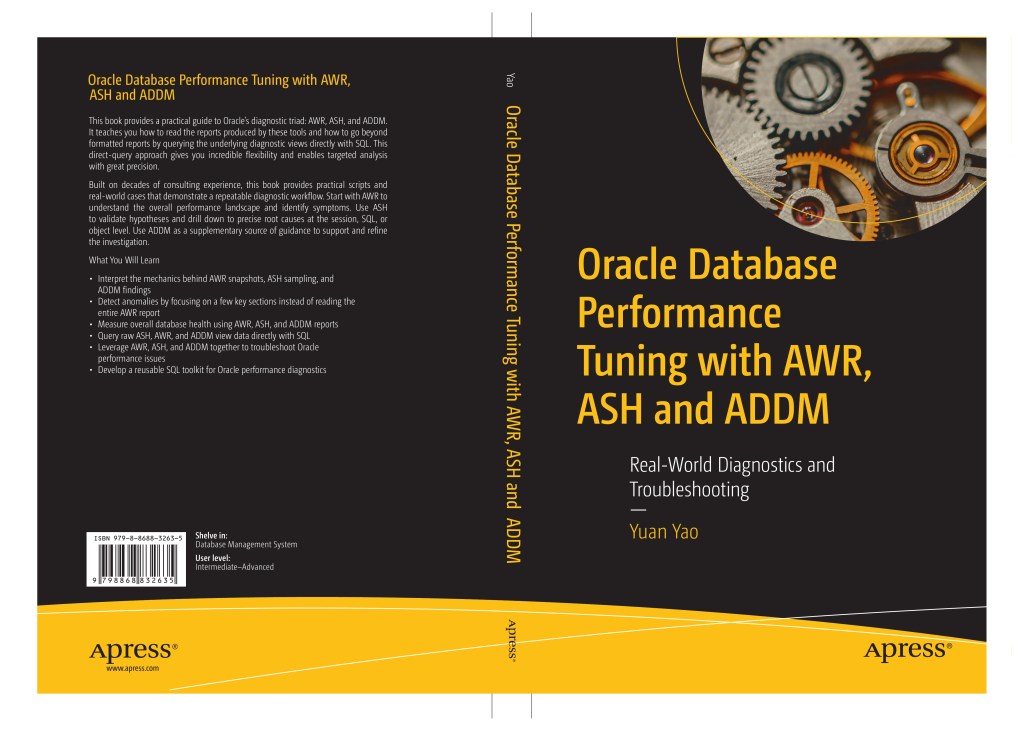
Table of Contents
Front Matter
- About the Author (p. viii)
- About the Technical Reviewer (p. ix)
- Acknowledgments (p. xi)
- Introduction (p. xii)
PART I: ASH (p. 1)
CHAPTER 1: ASH Fundamentals (p. 14)
- The ASH Mechanism (p. 14)
- Advantages of ASH (p. 17)
- Hidden Parameters That Control ASH Behavior (p. 20)
- Licensing for AWR, ASH, and ADDM (p. 21)
- Summary (p. 26)
CHAPTER 2: ASH Report (p. 26)
- Generating an ASH Report (p. 26)
- An Example of Interpreting an ASH Report (p. 30)
- Summary (p. 37)
CHAPTER 3: Querying Raw ASH Data with SQL (p. 37)
- ASH Data Capture Mechanism (p. 38)
- Identifying Top Entities (p. 44)
- Summarizing Session Activity across Any Dimensions (p. 51)
- Creating Timelines of Anything with Oracle ASH (p. 56)
- Answering Ad Hoc Questions (p. 62)
- Summary (p. 69)
CHAPTER 4: ASH in Action: Practical Use Cases (p. 69)
- Pinpointing the Slowest Step in an SQL Execution Plan (p. 70)
- Monitoring SQL Execution Plan Changes (p. 74)
- Estimating SQL Runtime and Detecting Outliers (p. 76)
- Determining Whether the Database Is Responsible for Slow Response (p. 86)
- Tracing the Session Blocking Chain (p. 89)
- Diagnosing an RMAN Job Slowdown (p. 98)
- Summary (p. 101)
PART II: AWR (p. 101)
CHAPTER 5: AWR Fundamentals (p. 101)
- The AWR Mechanism (p. 101)
- AWR Snapshots (p. 103)
- Managing AWR in Multitenant Environments (p. 113)
- Generating AWR Reports (p. 116)
- DB Time (p. 126)
- Average Active Sessions (p. 129)
- Summary (p. 134)
CHAPTER 6: How to Read an AWR Report (p. 135)
- Report Header (p. 136)
- Load Profile (p. 140)
- Instance Efficiency Percentages (p. 154)
- Top 10 Foreground Events (p. 157)
- Wait Classes by Total Wait Time (p. 168)
- I/O Profile (p. 174)
- Time Model Statistics (p. 180)
- SQL Statistics (p. 183)
- Summary (p. 194)
CHAPTER 7: Querying Raw AWR Data with SQL (p. 195)
- Understanding Raw AWR Data (p. 196)
- Monitoring Database Activity with System Statistics (p. 199)
- Analyzing Service-Level Statistics (p. 210)
- Gauging System Performance with Metrics (p. 217)
- Analyzing SQL Performance across Snapshots (p. 227)
- Monitoring I/O Activity (p. 240)
- Tracking Tablespace Usage and Growth (p. 254)
- Summary (p. 259)
PART III: ADDM (p. 259)
CHAPTER 8: Automating Diagnostics with ADDM (p. 259)
- Working with AWR and ASH (p. 260)
- ADDM Reports (p. 262)
- Mining Hidden Treasures from ADDM Views (p. 275)
- Summary (p. 286)
PART IV: USING THE TRIAD IN ACTION (p. 286)
CHAPTER 9: How Oracle Uses CPU (p. 286)
- Most IT Pros Read CPU Metrics Wrong (p. 287)
- Why Does CPU Utilization Lie to You? (p. 294)
- How Oracle Calculates CPU Metrics (p. 300)
- Detecting CPU Noisy Neighbors (p. 305)
- How to Detect CPU Starvation and Evaluate Its Severity (p. 310)
- Summary (p. 317)
CHAPTER 10: What’s the AWR Report Trying to Tell Us? (p. 317)
- Assessing Overall I/O Latency with Little’s Law (p. 318)
- Estimating Storage Response Time with Synchronous Single-Block Reads Latency (p. 319)
- Are Your Online Redo Logs Adequately Sized? (p. 324)
- Does Your Application Properly Use Bind Variables? (p. 327)
- Is There Excessive Rollback Activity in the Database? (p. 341)
- Is Your PGA Size Set Correctly? (p. 345)
- Do You Really Need RAC? (p. 351)
- Is Your Connection Pool Properly Sized? (p. 363)
- Summary (p. 372)
CHAPTER 11: Real-World Case Studies (p. 372)
- Slow Standby Database Dragging Down the Primary (p. 373)
- Finding the Contended Rows Behind enq: TX – row lock contention (p. 379)
- Zeroing In: Tracing the Exact Moment of Performance Regression (p. 383)
- Finding the Cause of Severe “Buffer busy wait” (p. 390)
- When the Average Lies: Detecting Skewed I/O Latency (p. 394)
- Why 90% Idle CPU Became a Bottleneck (p. 398)
- Summary (p. 409)


 Yuan Yao, An Oracle ACE's Blog
Leave a comment