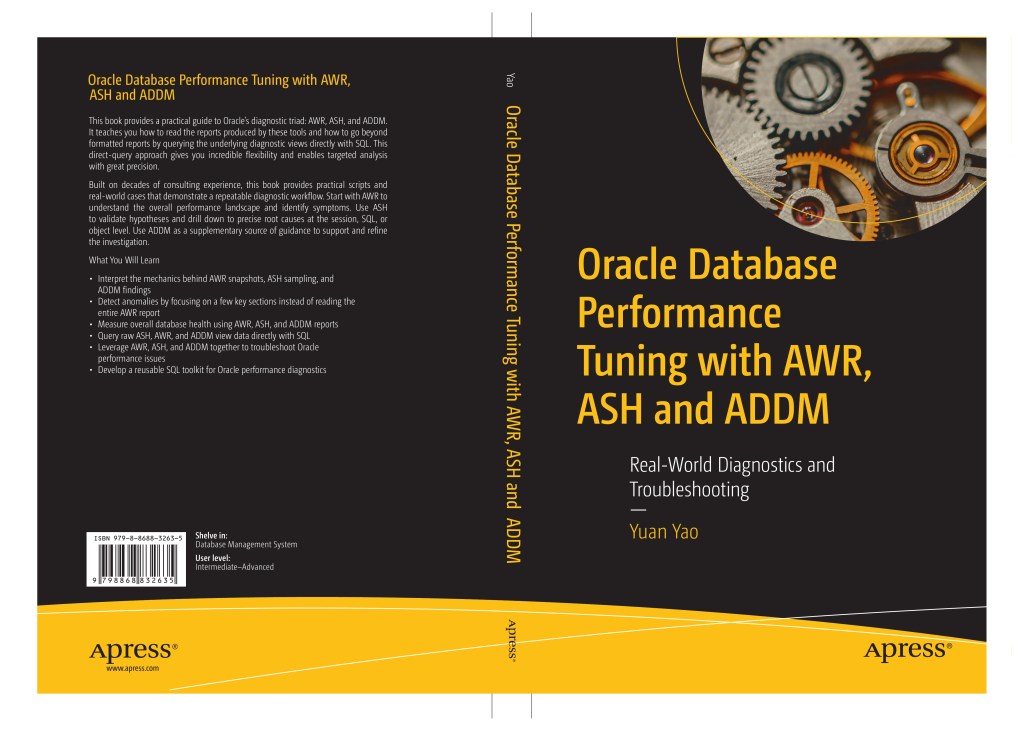
I am delighted to share that my new Oracle book, Oracle Database Performance Tuning with AWR, ASH and ADDM, will be published by Apress.
For readers interested in the book, I will share a series of previews here. This second post covers the section “How This Book Is Structured.”
How This Book Is Structured
This book consists of eleven chapters organized into four parts. Parts I through III cover ASH, AWR, and ADDM, while Part IV applies this diagnostic triad to practical performance investigations.
Part I ASH
Chapter 1, ASH Fundamentals
This chapter explains the core concepts of Active Session History (ASH), including its capture mechanism, key advantages, parameters that control its behavior, and licensing requirements.
Chapter 2, ASH Report
This chapter shows how to generate a standard ASH report using graphical tools or Oracle-supplied scripts. It then demonstrates how to interpret the report through a practical example.
Chapter 3, Query Raw ASH Data with SQL
Standard ASH reports present ASH data in a fixed format, which may not suit every performance investigation. This chapter teaches you how to query raw ASH data directly using SQL, offering greater flexibility for different diagnostic needs. It explains how to understand ASH data, identify top entities, summarize session activity across any dimensions, create timelines of session activity, and answer ad hoc questions. The chapter also includes practical scripts that can be adapted to specific diagnostic requirements with minimal modification.
Chapter 4, ASH in Action: Practical Use Cases
This chapter presents practical cases that demonstrate how ASH can be used for performance diagnosis and troubleshooting. It shows how to pinpoint the slowest step in an SQL execution plan, monitor execution-plan changes, estimate the runtime of individual SQL executions and detect outliers, determine whether the database is responsible for a slow response, trace a session blocking chain, and diagnose a sudden RMAN job slowdown. These cases provide practical ideas that readers can adapt to their own performance investigations.
Part II AWR
Chapter 5, AWR Fundamentals
This chapter introduces the Automatic Workload Repository (AWR), explaining its mechanism, AWR snapshots, management in multitenant environments, and the generation of AWR reports. It also explains DB Time and Average Active Sessions (AAS), two fundamental measures for assessing database workload and performance.
Chapter 6, How to Read an AWR Report
Interpreting an AWR report can be intimidating because it may span dozens of pages and contain thousands of statistics. This chapter presents a targeted approach to reading the report, covering the report header, Load Profile, Instance Efficiency Percentages, Top 10 Foreground Events, Wait Classes by Total Wait Time, I/O Profile, Time Model Statistics, and SQL Statistics. Rather than examining every metric with equal attention, you will learn how to identify the sections that provide the most relevant evidence for a particular performance investigation.
Chapter 7, Querying Raw AWR Data with SQL
Oracle generates AWR reports from historical repository views, but querying these views directly with SQL provides greater flexibility for customized analysis. This chapter explains how to understand raw AWR data, monitor database activity through system statistics, analyze service-level statistics, evaluate system performance with metrics, analyze SQL performance across snapshots, monitor I/O activity, and track tablespace usage and growth. It includes practical SQL techniques that can be adapted to investigate specific historical performance issues.
Part III ADDM
Chapter 8, Automating Diagnostics with ADDM
This chapter explains how the Automatic Database Diagnostic Monitor (ADDM) automates performance diagnosis and works together with AWR and ASH. It shows how to generate and interpret ADDM reports, including a case that uses a Comparing ADDM Periods report to resolve the mystery of why a lightweight incremental backup job degraded business performance while a much larger full backup job caused no noticeable impact. It also shows how to query ADDM-related views to uncover diagnostic findings, recommendations, and other valuable details that may not be apparent from the reports alone. Together, these topics provide both a conceptual understanding of ADDM and practical techniques for using it effectively.
Part IV Using the Triad in Action
This part brings together the three diagnostic tools introduced in the earlier parts of this book: ASH, AWR, and ADDM. It applies them in combination to investigate and resolve real-world database performance problems.
In the report format used in this part, ASH and ADDM output are appended to the AWR report. Accordingly, references to an AWR report in this part refer to the integrated use of AWR, ASH, and ADDM evidence.
Chapter 9, How Oracle Uses CPU
CPU is the most fundamental resource affecting Oracle Database performance, yet CPU statistics are frequently misinterpreted. This chapter explains why CPU utilization can be misleading, how multi-core processors and simultaneous multithreading complicate its interpretation, and how Oracle calculates host-level and instance-level CPU metrics. It also shows how to identify CPU-noisy neighbors that compete with the database for CPU cycles, recognize the symptoms of CPU starvation in an AWR report, and assess their severity using a scarcity ratio. These techniques are particularly useful in cloud environments where access to operating-system-level data may be restricted.
Chapter 10, What’s the AWR Report Trying to Tell Us?
An AWR report can answer more than general questions about database performance. By correlating information from different report sections and applying targeted calculations, this chapter shows how to answer strategic questions about the health of your database: assess overall I/O latency using Little’s Law, estimate storage response time from synchronous single-block reads, determine whether online redo logs are adequately sized, and identify improper use of bind variables. It also explains how to investigate excessive rollback activity, validate PGA sizing, decide whether RAC is necessary, and assess whether the connection pool is properly sized.
Chapter 11, Real-World Case Studies
This chapter brings the techniques introduced earlier in the book into practice through six real-world performance investigations.
The cases cover a slow standby database that drags down the primary, the rows behind an enq: TX - row lock contentionwait, the exact moment of a performance regression, the cause of a severe buffer busy wait, skewed I/O latency hidden by averages, and a database that became a bottleneck despite 90 percent idle CPU. Together, these investigations demonstrate how the diagnostic triad can be applied to distinguish visible symptoms from underlying causes and support practical remedies.


 Yuan Yao, An Oracle ACE's Blog
Leave a comment