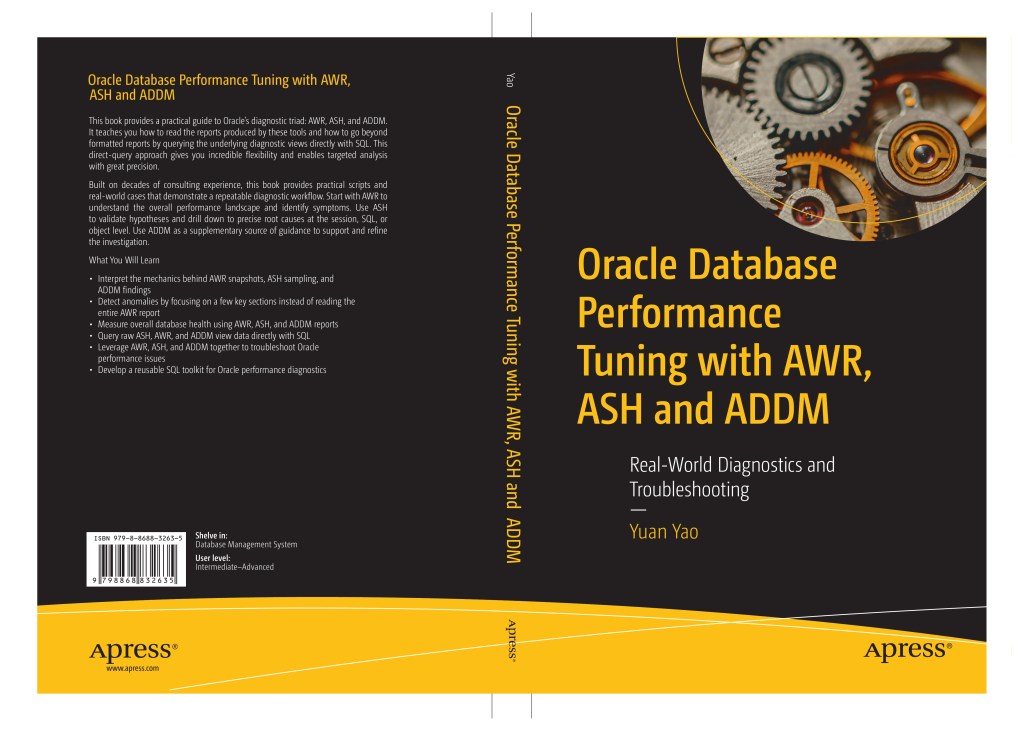
I am delighted to share that my new Oracle book, Oracle Database Performance Tuning with AWR, ASH and ADDM, will be published by Apress.
For readers interested in the book, I will share a series of previews here. This first post covers the section “Why I Write This Book.”
Why I Write This Book
An Underutilized Diagnostic Triad
Since their introduction in Oracle Database 10g, ASH (Active Session History), AWR (Automatic Workload Repository), and ADDM (Automatic Database Diagnostic Monitor) have been my favorite performance-tuning tools for more than twenty years. They have made the work of a DBA much easier by preserving the evidence needed to investigate performance problems after they occur. With this treasure trove of historical diagnostic evidence, a DBA can often determine the root cause of a performance issue without needing direct access to the affected database.
Yet, despite their importance in Oracle performance tuning for more than two decades, it is surprising that, to the best of my knowledge, no book-length treatment devoted specifically to any of these essential tools is currently available. While many excellent Oracle performance-tuning books out there discuss ASH, AWR, and ADDM, they usually cover them only in a single chapter or scattered sections. The result is often descriptive coverage that provides a high-level overview rather than the technical depth required for real-world troubleshooting. This lack of focused literature has contributed to the widespread underutilization of this powerful diagnostic suite.
Over the past twenty years, I have accumulated a wealth of knowledge, practical experience, troubleshooting cases, and SQL scripts for using these tools. I have long felt uncomfortable that, despite their power, these three tools remain underutilized. I therefore feel compelled to write this book to fill this gap in the field. Its aim is to teach you how to read and use these reports effectively, making your performance-tuning work easier by taking full advantage of this diagnostic triad.
Developing Your Ability to Interpret These Reports
Many database professionals feel deterred from reading these reports because the sheer volume of statistics can be daunting, and the meaning of individual statistics and metrics, as well as the relationships among them, can be obscure. Actually, you do not need exhaustive knowledge before exploring these reports. Understanding a few key concepts and the underlying mechanisms is sufficient to start applying them in real-world scenarios. A learn-as-you-go approach allows your knowledge, experience, and reliable intuition to develop progressively along the way, and this book is structured around that philosophy.
One practical approach when investigating a performance issue is to read the AWR report selectively. You do not need to read an AWR report from beginning to end. Begin at the report header and read through the Time Model Statisticssection. These opening sections account for only a small portion of the entire report, yet provide enough high-level evidence to determine where user sessions spend time and how the database consumes resources. Once you know where sessions spend time and how the database consumes resources, you can read the remaining sections selectively to investigate the suspected source of the problem.
Understanding Individual Statistics and Metrics
To interpret these reports precisely, you should first understand where Oracle retrieves each statistic and how it calculates each metric. To illustrate these details, I wrote custom SQL queries that reproduce key sections of the AWR reports from the underlying repository views. You may regard this as a form of reverse-engineering, but it is entirely my own research work: it does not use or reproduce Oracle source code.
By reading these SQL scripts, you can trace each statistic back to its source and understand the mathematical logic behind each metric. This enables you to look beyond the surface of a report and interpret its data with significantly greater depth.
Reverse-engineering the reports also helps us understand the temporal nature of the statistics and metrics they present:
- Many statistics stored in the underlying performance views are cumulative counters. To obtain the value for a reporting interval, Oracle subtracts the value at the beginning of the interval from the value at the end.
- Many reported metrics are rates, averages, or percentages calculated for the reporting interval.
- Some values are point-in-time values, such as the session counts displayed at the beginning of the AWR report header.
- Some values require special interpretation. For example,
Load Average BeginandLoad Average Endin the Host CPU section are snapshots ofV$OSSTAT.LOAD. On Linux, this corresponds to the operating system’s one-minute load average. They therefore represent snapshots of a rolling one-minute average, rather than interval deltas or averages calculated across the entire AWR reporting interval.
Understanding the temporal nature of each reported value is essential for interpreting it correctly.
Correlating Statistics and Metrics to Answer Key Questions
Interpreting statistics in isolation is not enough to understand these reports deeply. You must correlate evidence from different report sections, and this book provides many examples of how that correlation can answer important performance questions.
The I/O Profile section provides comprehensive information about database I/O activity, but it does not directly answer a critical question: how fast are the I/O requests being completed? This section alone cannot answer that question. However, when it is correlated with the Wait Classes by Total Wait Time section, the answer can be derived.
The I/O Profile provides the I/O request rate, while the User I/O and System I/O wait classes provide the average number of active sessions waiting for I/O. By applying Little’s Law, a fundamental relationship in queueing theory expressed as L = λW, we can derive the average I/O response time: divide the average number of sessions waiting for I/O by the I/O request rate. This enables AWR statistics from two different sections to reveal the average I/O response time that neither single section reports directly.
Another important question is how much time Oracle processes spend waiting in the operating system CPU run queue. No standard AWR section directly reports this value on Linux or Windows. On some traditional UNIX platforms, Oracle exposes OS_CPU_WAIT_TIME in the Operating System Statistics section. It stands for the total time that processes were in the ready state, waiting to be selected by the operating system scheduler to run.
Another way to assess this CPU wait time is by comparing AWR and ASH CPU statistics. AWR derives DB CPU from the operating system CPU time actually consumed by Oracle processes. In contrast, the ASH event CPU + Wait for CPUincludes both time spent executing on CPU and time spent waiting in the operating system run queue, because Oracle cannot distinguish the two states when a process is involuntarily removed from the CPU by the operating system scheduler. The difference between the ASH CPU figure and the AWR DB CPU figure therefore reflects the time Oracle processes spent waiting for CPU.
Many performance abnormalities leave footprints throughout the reports. The same underlying problem can appear as a dominant wait event, an unusual time-model statistic, a resource-utilization imbalance, or anomalous SQL activity. When these symptoms are correlated, they can reinforce or challenge a hypothesis and provide a clearer picture of the underlying cause.
Learning from Real Reports and Controlled Experiments
Understanding individual statistics and their correlations is only the beginning. You must also read many real-world reports to develop practical diagnostic ability and an intuitive feel for the otherwise lifeless figures. Different reports are generated under different workloads, configurations, application characteristics, and environments. Studying them helps you develop the ability to interpret the same statistics in different contexts.
Reports from controlled experiments are equally valuable. By applying a specific pressure to a database and examining the resulting statistical changes in AWR and ASH, you can develop a reliable intuition for how performance problems manifest in the reports. You can also use experiments to verify or refute your hypotheses, bridging the gap between theory and observation.
Looking Behind the Reports
Another driving factor for writing this book is the observation that many DBAs rely solely on formatted reports without querying the underlying dictionary views from which the reports are built. In reality, these views contain far richer and more detailed information than the formatted reports present. I refer to this underlying information as raw diagnostic data, including:
- ASH data: Current sampled session activity in
V$ACTIVE_SESSION_HISTORYand historical sampled session activity inDBA_HIST_ACTIVE_SESS_HISTORY. - AWR data: Historical workload and performance data in the
DBA_HIST_*views. - ADDM data: Diagnostic findings, recommendations, tasks, and related details in the
DBA_ADDM_*andDBA_ADVISOR_*views.
Querying these views with SQL not only aligns with the way DBAs naturally approach investigation, but also provides far more flexibility in addressing specific performance issues.
In addition, writing SQL makes it possible to perform analyses that a single report cannot support, such as examining performance fluctuations across multiple intervals and joining data from different views to produce new insights.
Home-grown SQL scripts can also reveal valuable information that predefined reports do not provide. For example, DBA_HIST_SYSMETRIC_SUMMARY retains approximately 160 system metrics. Most of these metrics are valuable for diagnosis but are not displayed in the standard AWR report; SQL Service Response Time is one example. They can be examined only by querying the underlying views.
This book provides many practical SQL scripts for querying these views. Most can be applied in your own environment with little or no modification.
Clarifying Common Misconceptions
Another reason for writing this book is to clarify several deep-rooted and widespread misconceptions about Oracle performance.
CPU is the brain of a computer, so IT professionals should be able to interpret CPU usage correctly. Yet many IT professionals, novice and experienced alike, misinterpret CPU utilization.
For example, many people interpret 40% CPU utilization on a single logical CPU as meaning that 60% of CPU capacity is sitting idle and immediately available. This is incorrect. At the level of an individual CPU cycle, CPU utilization is effectively binary: a logical CPU is either busy or idle; it is not 40% busy during that cycle. The reported 40% utilization is an average over a measurement interval. For a single logical CPU, a runnable process therefore has, on average, a 40% chance of waiting for CPU when it arrives at a random time. This book also extends this single-CPU probability model to multi-core systems.
Another common misconception about CPU arises from simultaneous multithreading technologies, such as Intel Hyper-Threading and IBM SMT, which can greatly distort CPU usage readings and lead to false comfort. This book explains why CPU usage reported by the operating system should always be translated from logical CPUs to physical CPU cores.
Another common misconception concerns RAC: migrating an application from a single-instance database to a multi-instance RAC architecture does not necessarily improve performance or scalability. This book explains the key factors required for a successful RAC implementation and shows how to analyze RAC AWR reports to determine whether a single instance can support the workload and, in some cases, deliver better performance.
This book also tries to clarify other misconceptions. For example, it explains the differences in the load metric between Linux and traditional UNIX systems, and why an SQL statement that processes only one row at a time may appear efficient at the micro level but be inefficient at the macro level.


 Yuan Yao, An Oracle ACE's Blog
Leave a comment